Human travel patterns reflect geographic boundaries rather than universal laws
Lockdown mobility records indicate that the heavy-tailed power laws seen in human displacement data are statistical artifacts created by pooling people who move within distinct local containers.
When people move through their everyday lives, most journeys stay close to home while a rare few span hundreds of kilometers.1 For nearly two decades, statistical physicists and urban theorists have described this disparity as scale-free, arguing that human travel follows a heavy-tailed distribution known as a power law, where movement patterns look fundamentally identical across short walks and continental flights.1 Under this view, human wandering resembles the erratic trajectories seen in foraging animals, known as Lévy flights, implying an intrinsic universal pattern across individual human behavior.1
Untangling how populations navigate physical space matters directly for practical public planning. If human wandering follows an innate mathematical law that operates identically at every spatial scale, city planners and epidemiologists must assume that individuals will naturally generate long-distance hops regardless of local geography. Conversely, if journeys are governed by the physical containers people inhabit, interventions such as targeted transit investments or localized epidemic quarantines can focus on the boundaries dividing those containers.
The causal chain linking individual trips to aggregate patterns begins with daily routines. A person leaves home, visits a corner grocery store, drops children off at a local school, and returns, with nearly all daily journeys remaining contained inside their immediate neighborhood. A smaller subset of people commutes across a wider metropolitan boundary to reach a workplace, and an even smaller group regularly crosses regional borders. When an analyst gathers millions of these separate trajectories and plots the whole population on a single distribution, trips originating from compact neighborhoods mingle with journeys from expansive regional commuter sheds. What appears on a combined graph as an unbroken, heavy-tailed distribution across all scales could simply be a composite blend of these distinct localized lives.
A competing mathematical hypothesis proposes something far simpler. In this alternative framework, individuals move within defined spatial containers, such as neighborhoods, towns, or metropolitan areas, following ordinary lognormal distributions where journeys cluster around characteristic local scales.1 The heavy tail of extreme displacements that looks like a power law on a national chart would then simply be an aggregation artifact created by pooling people who operate inside containers of vastly different geographical sizes.1 Because both mathematical models can closely mimic the same whole-population curves, deciding which mechanism drives actual human movement has proved notoriously difficult.1
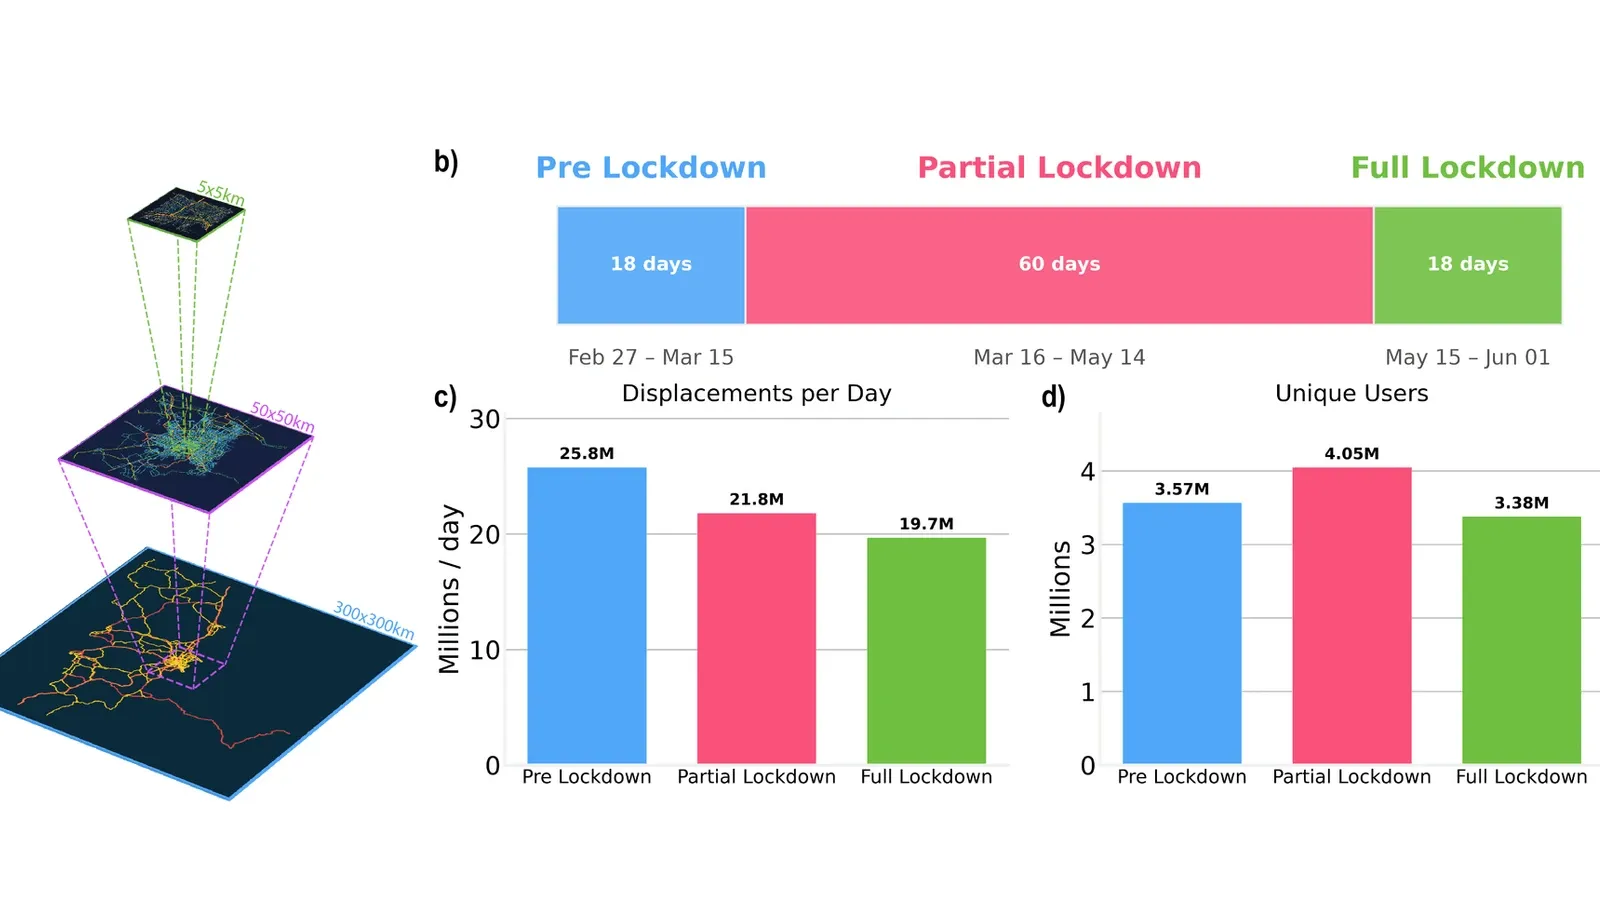
In a preprint posted to the arXiv server on August 25, 2026, computational scientists Leo Ferres and Bruno Gonçalves exploited the widespread mobility restrictions during the 2020 COVID-19 pandemic to test these models directly.3 By removing long-range trips while leaving localized movements largely intact, the lockdowns created a natural experiment that isolated localized movement from cross-container travel.1
How do individual journeys differ from pooled population data?
Individual travel records remain predominantly lognormal when long-distance journeys disappear, whereas the apparent power-law pattern breaks down under scrutiny. Ferres and Gonçalves analyzed 2.1 billion displacements recorded from 4.4 million anonymized mobile-phone users in Chile across three distinct observational periods.13 When the researchers examined the aggregate population during lockdowns, the mathematical exponent of the overall distribution steepened from 1.66 to 1.74, a shift that could also be reproduced simply by resampling the pre-lockdown population to match lockdown activity.1
Bruno, a co-author of the preprint, said in response to questions from Primary that this shift illustrates why population composition matters. As Bruno explained, "the resampling procedure overshoots the lockdown exponent (it goes to 1.8), meaning that this change in population composition alone is more than enough to explain the observed behavior." Bruno added that "if the exponent had remained flat or even decreased, that would have strongly indicated that the container model wasn't a good fit since a mixture can't lose its largest-scale pieces and grow a heavier tail."
To test whether individual trajectories reflected this power-law behavior, the researchers examined user histories across the three periods. They found that lognormal classification proved stable, retaining 81 percent of users in that category across periods, while the power-law classification was fragile, retaining only 32 percent. The users who changed classification were precisely those whose personal travel radius experienced the greatest collapse during quarantine restrictions.1
Bruno told Primary that individual data contradicted the scale-free model directly. "When Leo looked at individuals' behavior during the lockdown, it became clear that the behavior no longer resembled a power law. This clearly contradicted what you would expect if the power-law hypothesis were valid. On the other hand, under the lognormal hypothesis, this is exactly what we would expect," Bruno said.
When the authors matched sample sizes, the tails of individual user distributions consistently rejected a power law, whereas artificial mixtures of equal size drawn across multiple users passed the test.1 Formal statistical tail tests detected no valid power-law threshold across the full dataset, and the apparent power-law behavior vanished whenever sample sizes exceeded 10,000 data points.1
Asked about this specific sample ceiling, Bruno told Primary that "that 10,000 value isn't a magical number, but rather just a rough estimate of how many points you need to have enough statistical power to properly measure the tail of the distribution." Bruno described it as "the point where we have enough observations in the tail of the distribution to be able to clearly distinguish between the two hypotheses."
Why does pooling separate spatial containers create a heavy tail?
Combining separate lognormal distributions centered at different distances produces a composite curve that resembles a straight line on logarithmic axes. Bruno illustrated this mechanism through geometric curves. "You can think of lognormals as parabolas in log-log space, while power laws are straight lines. Each parabola is centered at a specific point and falls off to both sides. Now imagine a set of parabolas centered at different points, one at the neighborhood scale, one at the city scale, etc. As one parabola starts dropping off, the next one is increasing, and so on. This makes it easy to see how you can get a continuous line by summing multiple parabolas," Bruno said. When parabolas decrease in height at longer distances because fewer people travel long paths, the summed line slopes downward, creating what appears to be a single power-law exponent across the population.
A level mixture model that combined separate spatial scales reconstructed the aggregate distribution with an R-squared value of up to 0.98.1 Bruno stated that "we define the container thresholds at 5, 50, and 300km, corresponding to neighborhood, city, and region," noting that the model represents a weighted sum across those geographic domains.
While the level mixture model explains the aggregate curve, the researchers observed that a standardized radius-of-gyration collapse failed and worsened under lockdown conditions, with the coefficient of variation moving from 0.62 to 0.76, and the steepening of the distribution concentrated significantly among wide-ranging users with a p-value of 0.0003.1 Bruno explained that this failure stems from selective behavioral dropouts during restrictions. As Bruno noted, "it's not so much a change in behavior, but rather an elimination of specific subtypes of behavior. Commutes were canceled; intercity travel was dropped; but your trip to your neighborhood grocery store remained the same."
What can these mobility findings not tell us?
The projections and statistical fits described in the preprint represent observational measurements of cell-tower transitions during exceptional quarantine conditions, meaning they cannot capture all ordinary mobility patterns. The research was posted to arXiv on August 25, 2026, and has not yet undergone formal peer review.3 Because the underlying data relies on transitions between mobile towers, movements occurring entirely within the coverage area of a single cellular tower remain unrecorded.
Bruno acknowledged these observational boundaries when discussing the container framework. "The lognormal behavior is cleanest at the neighborhood level (below 5km) and mixed at the city level (5- 50 km)," Bruno told Primary, attributing this partly to boundaries that may not reflect complex urban topography, such as polycentric cities with multiple downtown cores. Bruno also noted that transitional phases between quarantine tiers blend distinct behaviors together, and stated that because "we are using tower-to-tower distances as proxies for actual movements, we are effectively unable to see any movement within a given tower coverage area, so we can't make any strong claims in that distance range."
How does this shift reshape epidemic modelling?
Untangling whether mobility distributions stem from container geography or individual behavior will shape how epidemiologists model future infectious outbreaks. If disease transmission across regions depends on bridging between lognormal spatial containers rather than an inherent scale-free dynamic, public health interventions can focus more precisely on inter-district transport links rather than treating all human movement as an unbroken, scale-free continuum.
Understanding that heavy-tailed travel curves arise from spatial containers allows planners to design interventions matching real urban architecture. Rather than relying on universal mathematical distributions that assume individuals naturally wander across arbitrary distances, future travel models can account directly for the physical borders of neighborhoods and cities. Ferres and Bruno plan to explore how changing restriction levels alter these container mixtures in future research, clarifying how human movement adapts as structural boundaries open and close.
This piece was prepared from the arXiv preprint and public records together with answers from Bruno to seven questions from the Primary news team, completed September 2026.
The record
37 sentences trace to 2 sources and 1 contributor.
-
1
LF
Leo Ferres, Bruno Gonçalves Paper · arxiv.org · 25 Aug 2026 The power law in human mobility is a mixture artifact: evidence from a pandemic natural experiment Preprint · may not have been peer reviewed See the source
- 2 Contribution — Bruno Gonçalves 21 statements added to this article
-
3
L
linkedin.com Third-party reporting · linkedin.com · 5 Aug 2026 BofA Focus: Environmental Infrastructure and AI Financing | Bank of America Business posted on the topic | LinkedIn See the source
Other consulted pages1 page
Article history
-
Published 26 Oct 2026, 14:29Assembled by the Primary desk from 2 sources · 1 contributor · 37 cited sentences
-
Bruno Gonçalves
- Go to the sentence: The heavy tail of extreme displacements that looks like a power law on a national chart would then simply be an aggregation artifact created by pooling people who operate inside containers of vastly different geographical sizes.
- Go to the sentence: By removing long-range trips while leaving localized movements largely intact, the lockdowns created a natural experiment that isolated localized movement from cross-container travel.
- Go to the sentence: Individual travel records remain predominantly lognormal when long-distance journeys disappear, whereas the apparent power-law pattern breaks down under scrutiny.
- Go to the sentence: When the researchers examined the aggregate population during lockdowns, the mathematical exponent of the overall distribution steepened from 1.66 to 1.74, a shift that could also be reproduced simply by resampling the pre-lockdown population to match lockdown activity.
- Go to the sentence: Bruno, a co-author of the preprint, said in response to questions from Primary that this shift illustrates why population composition matters.
- Go to the sentence: As Bruno explained, "the resampling procedure overshoots the lockdown exponent (it goes to 1.8), meaning that this change in population composition alone is more than enough to explain the observed behavior."
- Go to the sentence: Bruno added that "if the exponent had remained flat or even decreased, that would have strongly indicated that the container model wasn't a good fit since a mixture can't lose its largest-scale pieces and grow a heavier tail."
- Go to the sentence: Bruno told Primary that individual data contradicted the scale-free model directly.
- Go to the sentence: "When Leo looked at individuals' behavior during the lockdown, it became clear that the behavior no longer resembled a power law. This clearly contradicted what you would expect if the power-law hypothesis were valid. On the other hand, under the lognormal hypothesis, this is exactly what we would expect," Bruno said.
- Go to the sentence: When the authors matched sample sizes, the tails of individual user distributions consistently rejected a power law, whereas artificial mixtures of equal size drawn across multiple users passed the test.
- Go to the sentence: Formal statistical tail tests detected no valid power-law threshold across the full dataset, and the apparent power-law behavior vanished whenever sample sizes exceeded 10,000 data points.
- Go to the sentence: Asked about this specific sample ceiling, Bruno told Primary that "that 10,000 value isn't a magical number, but rather just a rough estimate of how many points you need to have enough statistical power to properly measure the tail of the distribution."
- Go to the sentence: Bruno described it as "the point where we have enough observations in the tail of the distribution to be able to clearly distinguish between the two hypotheses."
- Go to the sentence: "You can think of lognormals as parabolas in log-log space, while power laws are straight lines. Each parabola is centered at a specific point and falls off to both sides. Now imagine a set of parabolas centered at different points, one at the neighborhood scale, one at the city scale, etc. As one parabola starts dropping off, the next one is increasing, and so on. This makes it easy to see how you can get a continuous line by summing multiple parabolas," Bruno said.
- Go to the sentence: A level mixture model that combined separate spatial scales reconstructed the aggregate distribution with an R-squared value of up to 0.98.
- Go to the sentence: Bruno stated that "we define the container thresholds at 5, 50, and 300km, corresponding to neighborhood, city, and region," noting that the model represents a weighted sum across those geographic domains.
- Go to the sentence: While the level mixture model explains the aggregate curve, the researchers observed that a standardized radius-of-gyration collapse failed and worsened under lockdown conditions, with the coefficient of variation moving from 0.62 to 0.76, and the steepening of the distribution concentrated significantly among wide-ranging users with a p-value of 0.0003.
- Go to the sentence: As Bruno noted, "it's not so much a change in behavior, but rather an elimination of specific subtypes of behavior. Commutes were canceled; intercity travel was dropped; but your trip to your neighborhood grocery store remained the same."
- Go to the sentence: "The lognormal behavior is cleanest at the neighborhood level (below 5km) and mixed at the city level (5- 50 km)," Bruno told Primary, attributing this partly to boundaries that may not reflect complex urban topography, such as polycentric cities with multiple downtown cores.
- Go to the sentence: Bruno also noted that transitional phases between quarantine tiers blend distinct behaviors together, and stated that because "we are using tower-to-tower distances as proxies for actual movements, we are effectively unable to see any movement within a given tower coverage area, so we can't make any strong claims in that distance range."
- Go to the sentence: Ferres and Bruno plan to explore how changing restriction levels alter these container mixtures in future research, clarifying how human movement adapts as structural boundaries open and close.