Turbulence pushes surface pressure fluctuations toward deeper negative extremes
Shifting aerodynamic forces create asymmetric suction troughs against hulls and fuselages, revising long-standing acoustic and structural fatigue models for high-speed transit.
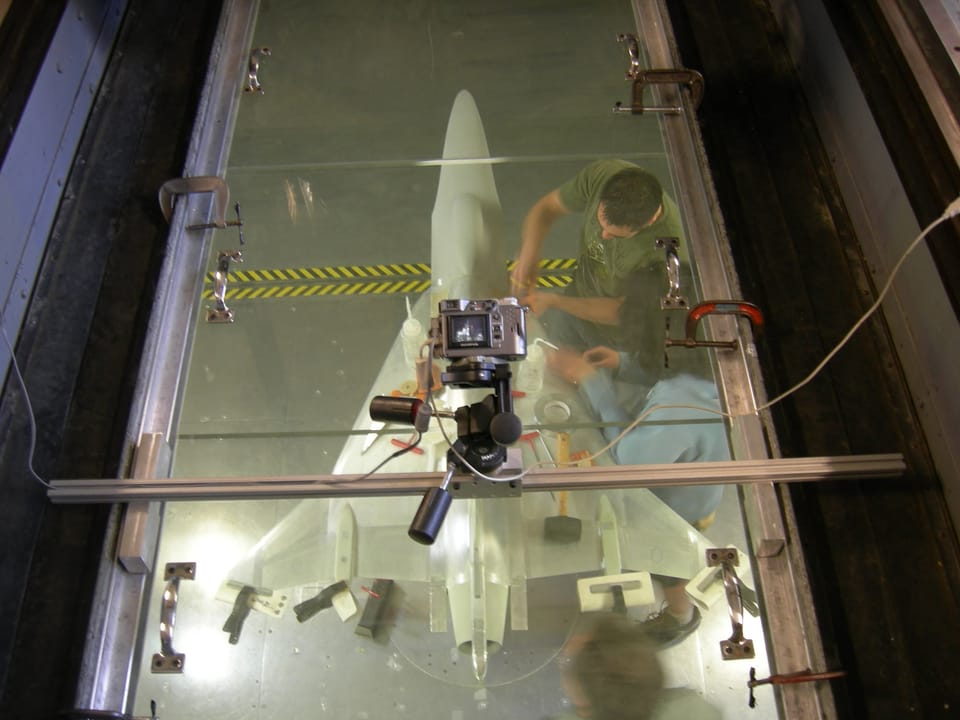
When air rushes past an aircraft fuselage or water flows along a submarine hull, the chaotic churning within the thin fluid boundary layer creates a fluctuating pressure against the solid surface beneath. These pressure shifts rumble against the skin of the vehicle, generating cabin noise and vibrating metal panels until microscopic fatigue cracks develop over time. Fluid physicists long treated these surface pressure swings as balanced disturbances, where sudden spikes of high pressure were thought to match dips of low pressure in rough symmetry.
That symmetry fails as flows move faster. In fast flows, the distribution of pressure swings tilts toward sudden dips rather than spikes, a mathematical asymmetry known as negative skewness. Understanding how this skewness shifts across flow speeds helps engineers forecast structural wear and vehicle acoustics, because deep pressure drops pull outward on vehicle surfaces, exciting structural vibrations that conventional models miss.
The mechanics behind this shifting surface pressure follow an intuitive physical sequence. As fluid streams across a surface, friction slows the fluid directly against the wall, establishing a velocity gradient that spawns tiny, localized vortex packets. Further away from the wall, in the outer boundary layer, these small packets organize into massive, meandering streaks of fast and slow fluid termed large-scale motions. Because the entire fluid layer is continuous, these towering outer structures press downward, stretching and modulating the tiny vortices spinning beneath them. When a massive sluggish streak glides overhead, it exerts an expansive pull on the wall layer, deepening instantaneous low-pressure troughs on the surface.
How does flow speed alter the surface pressure landscape?
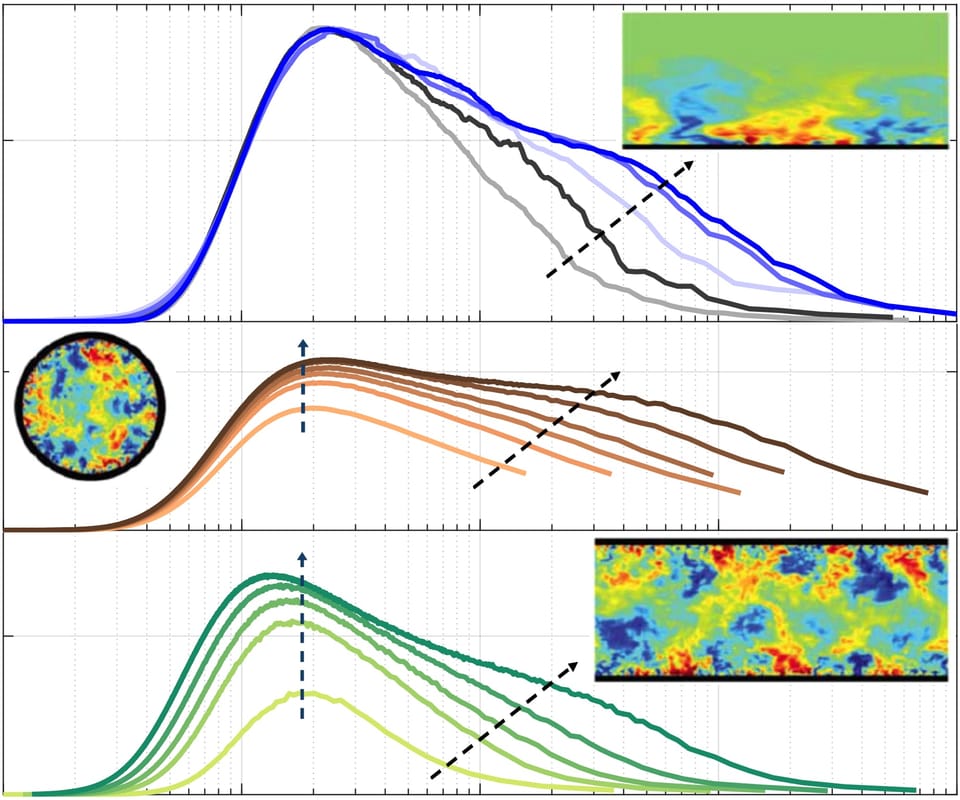
Wall pressure skewness becomes progressively more negative as flow speeds increase, according to a preprint posted by Rahul Deshpande and colleagues at the University of Melbourne.1 The researchers evaluated the friction Reynolds number, an engineering benchmark comparing inertial forces to viscous forces within the boundary layer, and observed that large-scale turbulent fluctuations in the logarithmic flow region grow increasingly energetic.1 These intensifying large-scale fluctuations carry a negative skewness of their own, which couples nonlinearly with positively skewed, small-scale motions spinning directly at the wall, pushing the overall surface pressure distribution toward negative values.1
This nonlinear interaction connects directly to the velocity signatures that drive the boundary layer. Deshpande explained that high-speed velocity motions overhead impose a distinct imprint near the wall. Rahul said in response to questions from Primary that high-speed velocity motions superimpose onto and modulate near-wall small scales more strongly than low-speed motions do, noting that these fast structures are inherently connected with negative wall-pressure footprints owing to their ability to locally accelerate the flow. Rahul added that greater the Reynolds number, stronger is the footprint of near-wall large-scale velocity and wall-pressure, leading to a more positive velocity skewness and more negative wall-pressure skewness.
By pairing wall pressure fluctuations with streamwise fluid velocity, the authors established that intermediate and large-scale spectral contributions connect directly to two coherent physical structures: a self-similar hierarchy of eddies attached to the wall, and elongated turbulent superstructures gliding overhead.1 In the preprint posted to arXiv on September 3, 2026, Rahul Deshpande, Balaraman Panneerselvam, Vijaya R. R. Gudla, Joe Klewicki, and Ivan Marusic reported that wall-pressure variance and skewness exhibit a logarithmic variation across increasing Reynolds numbers, linking changes at the wall directly to turbulent structures in the inertial layer.1
How did the researchers capture these fleeting pressure waves?
The researchers tracked pressure and velocity simultaneously across experimental facilities spanning several orders of magnitude in scale. Rahul Deshpande and colleagues conducted new measurements inside the Melbourne wind tunnel, capturing synchronous wall pressure and streamwise velocity over a friction Reynolds number range between 5,000 and 11,300.1 To examine how these trends persist at planetary scales, the authors compared their laboratory data against atmospheric surface-layer observations from Utah's western desert playa at a friction Reynolds number on the order of 1,000,000, as well as a published turbulent boundary layer simulation dataset at a friction Reynolds number on the order of 1,000.1
Reconciling measurements taken in natural desert winds with tightly regulated laboratory flows required specialized data screening. Rahul told Primary that the atmospheric records were gathered over several hundred burst events across two to three years of field campaigns. Rahul explained that the team used standard de-trending procedures, based on reference velocity signals measured by hotwires and sonic anemometres, to post-process and carefully analyze a subset of the full dataset for which we were confident about the signal quality.
Tracking these fluctuations also required overcoming acoustic challenges that corrupt boundary layer instruments. The authors showed that Helmholtz resonance, an acoustic ringing that occurs inside small sensor pinholes, contaminates the high-frequency measurements of inner-scale pressure motions even after standard mathematical corrections are applied.1 Rahul told Primary that the issue surfaced when frequency spectra began deviating from universal high-frequency scaling, occurring whenever the sensor plug resonance overlapped with the energetic range of the flow. To eliminate the artifact, the researchers redesigned their microphone-plug assembly such that its corresponding Helmholtz resonance always occurs beyond the energetic part of the wall-pressure frequency spectrum.
Rahul Deshpande and colleagues also demonstrated that calculating reliable skewness statistics requires exceptionally long sampling periods, needing data acquisition durations of 100,000 eddy-turnover times or longer to achieve statistical convergence.1 Rahul said the team tested such long durations after finding wide scatter across published studies, where reported skewness values failed to follow any logical trend with varying flow speeds.
What do these turbulent scaling limits leave unresolved?
The findings describe canonical boundary layers with zero pressure gradient, and they cannot directly forecast surface loads on complex curved wings or separating industrial flows. The underlying measurements also rest on the assumption that acoustic background noise and wind tunnel vibrations can be cleanly distinguished from true turbulent pressure signatures across every frequency band. Because the work remains a preprint that has not yet undergone peer review, the experimental corrections and scaling laws will require independent verification across other high-speed facilities.
Confirming whether the logarithmic trend continues indefinitely will also demand new experimental reach. Rahul noted that validating the scaling asymptotic limits requires well-resolved measurements at a friction Reynolds number between 100,000 and 1,000,000, which would demand specialized pressurized tunnels or atmospheric surface-layer instruments that present unique data acquisition challenges. Furthermore, real-world transport surfaces are rarely flat or smooth. Rahul told Primary that models require accurate data documenting specific conditions, explaining that future experiments must test whether these scaling laws hold in the presence of pressure gradients and surface roughness.
Even so, resolving this Reynolds number evolution helps explain why legacy spectral formulas, such as the Goody model, systematically misjudge low-frequency acoustic energy in high-speed flows, as noted by Jonathan M. O. Massey and colleagues in an earlier modeling study. By confirming that small-scale pressure spectra remain Reynolds-number invariant while large-scale signatures expand logarithmically, the Melbourne measurements provide a clearer foundation for engineering models of flow-induced noise, hull vibration, and structural fatigue in high-speed transport systems.13
This piece was prepared from the arXiv preprint and public records together with answers from Rahul to 6 questions from the Primary news team, completed September 2026.
The record
16 sentences trace to 2 sources and 1 contributor.
-
1
RD
 Rahul Deshpande, Balaraman Panneerselvam, Vijaya R. R. Gudla, Joe Klewicki, Ivan Marusic
Paper
· arxiv.org · 3 Sep 2026
Reynolds-number evolution of wall-pressure statistics beneath canonical turbulent boundary layers
Preprint · may not have been peer reviewed
See the source
- 2 Contribution — Rahul Deshpande 11 statements added to this article
-
3
A
arxiv.org
Paper
· arxiv.org
Two-component inner--outer scaling model for the wall-pressure spectrum at high Reynolds number
Preprint · may not have been peer reviewed
See the source
Other consulted pages1 page
ar5iv.labs.arxiv.org1 page
arxiv.org1 page
cambridge.org1 page
findanexpert.unimelb.edu.au1 page
Article history
-
Published 13 Nov 2026, 14:18Assembled by the Primary desk from 2 sources · 1 contributor · 16 cited sentences
-
Rahul Deshpande
- Go to the sentence: Wall pressure skewness becomes progressively more negative as flow speeds increase, according to a preprint posted by Rahul Deshpande and colleagues at the University of Melbourne.
- Go to the sentence: These intensifying large-scale fluctuations carry a negative skewness of their own, which couples nonlinearly with positively skewed, small-scale motions spinning directly at the wall, pushing the overall surface pressure distribution toward negative values.
- Go to the sentence: Rahul said in response to questions from Primary that high-speed velocity motions superimpose onto and modulate near-wall small scales more strongly than low-speed motions do, noting that these fast structures are inherently connected with negative wall-pressure footprints owing to their ability to locally accelerate the flow.
- Go to the sentence: Rahul added that greater the Reynolds number, stronger is the footprint of near-wall large-scale velocity and wall-pressure, leading to a more positive velocity skewness and more negative wall-pressure skewness.
- Go to the sentence: In the preprint posted to arXiv on September 3, 2026, Rahul Deshpande, Balaraman Panneerselvam, Vijaya R. R. Gudla, Joe Klewicki, and Ivan Marusic reported that wall-pressure variance and skewness exhibit a logarithmic variation across increasing Reynolds numbers, linking changes at the wall directly to turbulent structures in the inertial layer.
- Go to the sentence: Rahul explained that the team used standard de-trending procedures, based on reference velocity signals measured by hotwires and sonic anemometres, to post-process and carefully analyze a subset of the full dataset for which we were confident about the signal quality.
- Go to the sentence: The authors showed that Helmholtz resonance, an acoustic ringing that occurs inside small sensor pinholes, contaminates the high-frequency measurements of inner-scale pressure motions even after standard mathematical corrections are applied.
- Go to the sentence: To eliminate the artifact, the researchers redesigned their microphone-plug assembly such that its corresponding Helmholtz resonance always occurs beyond the energetic part of the wall-pressure frequency spectrum.
- Go to the sentence: Rahul Deshpande and colleagues also demonstrated that calculating reliable skewness statistics requires exceptionally long sampling periods, needing data acquisition durations of 100,000 eddy-turnover times or longer to achieve statistical convergence.
- Go to the sentence: Rahul noted that validating the scaling asymptotic limits requires well-resolved measurements at a friction Reynolds number between 100,000 and 1,000,000, which would demand specialized pressurized tunnels or atmospheric surface-layer instruments that present unique data acquisition challenges.
- Go to the sentence: Rahul told Primary that models require accurate data documenting specific conditions, explaining that future experiments must test whether these scaling laws hold in the presence of pressure gradients and surface roughness.